Cloudy With A Chance of Silver Linings (Part 1)
All that glitters are not just made of gold; they may be silver too. Aside making weapons of vampire slayers and medals for the Olympics (500 grams of silver is contained in each silver medal in case you’re wondering), silver plays a huge part in our lives, both in the goods and financial markets. There will be two parts to this article, where our main aim is to attempt a forecast of silver price movements. In this part, we will first consider the myriad uses of silver, its history, and its pricing mechanism. In Part 2, we will delve into the charts and data of silver prices and draw a projection based on what we know.
What is silver used for?
First, a brief understanding of the wide variety of uses of this metal would serve us well in understanding demand for it. Aside from the mainstream view of silver as jewellery material and a key material in coins and medals, there is strong demand for silver in:
- industrial chemical catalysts
- medicinal use
- photovoltaic (PV) cells.
In medicine, silver is an invaluable antibiotic, with the apparent ability of boosting effectiveness of antibiotics by up to 1000 times greater when used together! However, toxicity poses a health hazard and remains to be overcome before being used in the mass market.
Major companies are incorporating silver into other products however; for example, Johnson & Johnson adds silver into bandages and ointment as an active ingredient. Hospital use for purposes of sterilisation are also increasingly widespread. Read more about its other uses here.
Source: Statista
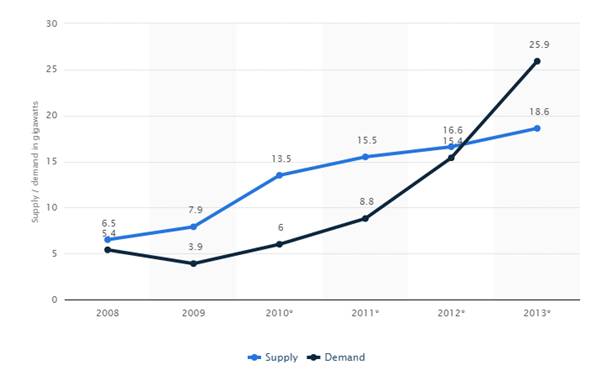
The demand for PV cells (the stuff that makes solar energy possible) shown in the chart above, has been soaring over the past few years, implying silver is in for a stronger demand in the future.
With China set to invest a whopping GBP292 Billion into renewable energy by 2020 (read more here) and Saudi Arabia also moving into renewables by 2030 of the order of US$30-50 billion, it’s safe to say that the demand for PV cells, and by extension silver, will be rising sky high (article here). This will provide further basis for our price action analysis later.
A History of Silver
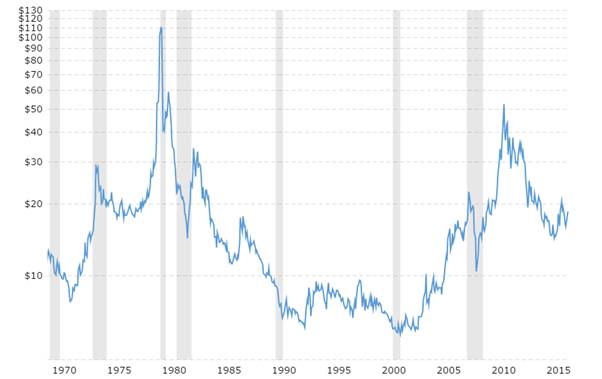
Two notable events in recent times have been very interesting for the price movements of silver. First, in 1979, the Hunt Brothers tried to monopolise the silver market by buying up billions of dollars’ worth of paper silver and silver futures. This can be seen by the abnormal spike in the chart below, before crashing back down. By hoarding the silver and artificially raising demand, they pushed the price to unprecedented levels.
However, the New York Mercantile Exchange and the US Fed Reserve intervened, placing restrictions on leveraged purchases of silver and causing the failure of the brothers to maintain their dominance. The event is frequently referred to as Silver Thursday. A more detailed history of the Hunts (including their attempt on the soy bean market) can be found here.
The second event is directly following the 2008 global financial crisis. The crisis scared investors into ‘safe’ investments (a debatable notion which I will argue against later), and gold and silver fall into that category. The flight to safety resulted in the spike up in 2010-2011, before a price correction back to stable levels when the fear had subsided. Standard and Poor’s rating downgrade in US Treasury Bonds (seen as the safest bonds in the world) may have played a big part in the scare.
It is also interesting to note how the price of silver always shows a noticeable decline every time a recession financial crisis occurs (shown by the shaded strips of time period). These drops are extremely sharp, demonstrating the volatility and danger of silver as an investment, contrary to the belief that silver is deemed a ‘safe’ investment like the case above (imagine holding silver when the price drops!).
Source: Macrotrends
Silver Price Action
Pricing Mechanism
Way back in the 16th century, even before the rise of the Gold Standard in the West, silver was valued at approximately 1:15.5 the value of gold. However, demonetization and market action have consistently pushed the value of silver lower over the centuries. The current ratio is somewhere in the region of 1:70-80!
Today, silver is priced in US dollars per ounce, although other forms of pricing (GBP denominated, EUR denominated) are also available. As silver is priced in USD, it is crucial to understand that most of the time, the US dollar and the price of silver will move inversely to each other. This is because if the US dollar rises in value, in can buy more ounces of silver per dollar! Think of US dollars as apples, and imagine how many apples you would have to give your broker in exchange for a tiny sliver of the metal.
However, it is not a universal law that USD and silver move in opposite directions; indeed, roughly 80% of the time this holds true, but over the past half month USD and silver have moved in the SAME direction! Note, a correlation value of 1 means they move together in perfect unison, while -1 means in perfect opposition. This could mean that a significant, fundamental movement in the price of silver that is unrelated to currency value movement is underway.
Source: Author, created with TradingView
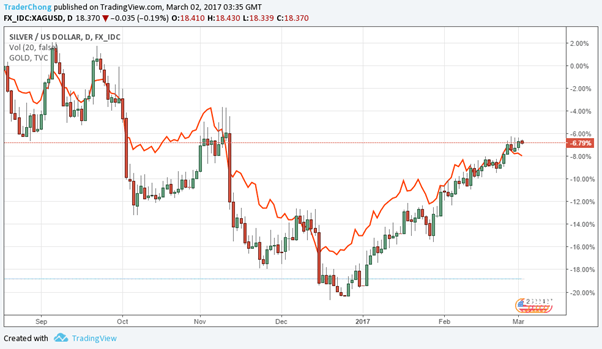
Interestingly, gold and silver, although of vastly different values, have price movements that are very similar. The chart below is in percentage scale, and shows percentage changes in prices relative to a fixed level. As we can observe, the trends coincide with each other, suggesting the two metals are very interrelated in terms of the fundamentals affecting their prices.
One might then wonder how trades in silver (or any other commodity for that matter) may be financed, given the sheer scale of the orders and worth. Contrary to what you may think, funding does not come from your mainstream commercial bank (we can imagine it would be slightly difficult to take out a $100 million loan from Santander to buy silver); instead, 80-90% of global trade (worth $10 trillion per year) is financed by trade finance. In trade finance, the financing entity acts as the middle-man and makes payment to the supplier on behalf of the buyer, while using non-traditional forms of collateral such as invoices and future payments. A more detailed explanation on trade financing can be found here by Trade Finance Global.
Source: Author, created with TradingView
Now that we have a deeper understanding of the factors driving demand and prices, we are in a good position to explain and analyse movements in prices in relation to world events. It’s hard to predict prices if we do not know what moves them! In Part 2 of this article, we will look at some charts and official figures, which we will be in a better position to make sense of.
Do follow the next article for more analysis on silver prices, it will certainly help you if you are looking to trade in commodities or just want to understand more!
 Australia
 Hong Kong
 Japan
Japan Singapore
 United Arab Emirates
 United States
 France
 Germany
 Ireland
 Netherlands
 United Kingdom


Comments are closed.